[ML] TF Logistic Regression Model Implementation
TF Logistic Regression Model Implementation
- 인프런 - Tensorflow 사용메뉴얼 - Binary Classification, reset_states of Metrics를 수강하고 개인적으로 정리한 내용입니다.
예시코드 및 정리문구는 강의내용 그대로 사용하지않고, 개인적으로 수정한 부분이 있음을 참고하여주시기 바랍니다.
import tensorflow as tf
import numpy as np
import matplotlib.pyplot as plt


# Save GPU memories
physcial_devices = tf.config.list_physical_devices('GPU')
for physical_device in physcial_devices:
    tf.config.experimental.set_memory_growth(device=physical_device, enable=True)


SEED = 7777
tf.random.set_seed(SEED)
np.random.seed(SEED)
Create Datasets
# Train Dataset
n_train = 300
train_noise = 0.2 * tf.random.normal(shape=(n_train, 1), dtype=tf.float32)
train_x = tf.random.normal(shape=(n_train, 1), dtype=tf.float32)
train_y = tf.cast(train_x + train_noise >= 0, tf.float32)

# Test Dataset
n_test = 100
x_min, x_max = tf.reduce_min(train_x).numpy(), tf.reduce_max(train_x).numpy()
test_x = np.linspace(x_min, x_max, n_test, dtype=np.float32).reshape(-1, 1)
test_x = tf.convert_to_tensor(test_x, dtype=tf.float32)

# Train Dataset Visualization
fig, ax = plt.subplots(figsize=(12, 6))
ax.set_title('Train dataset', fontdict={'fontsize': 15})
ax.scatter(train_x.numpy(), train_y.numpy(), alpha=0.5)
ax.tick_params(labelsize=20)
ax.grid()

Model Definition
# Model Definition
class BinaryClassifier(tf.keras.Model):
    def __init__(self):
        super().__init__()
        self.d1 = tf.keras.layers.Dense(units=1, activation='sigmoid')

    def call(self, x):
        preds = self.d1(x)
        return preds


model = BinaryClassifier()
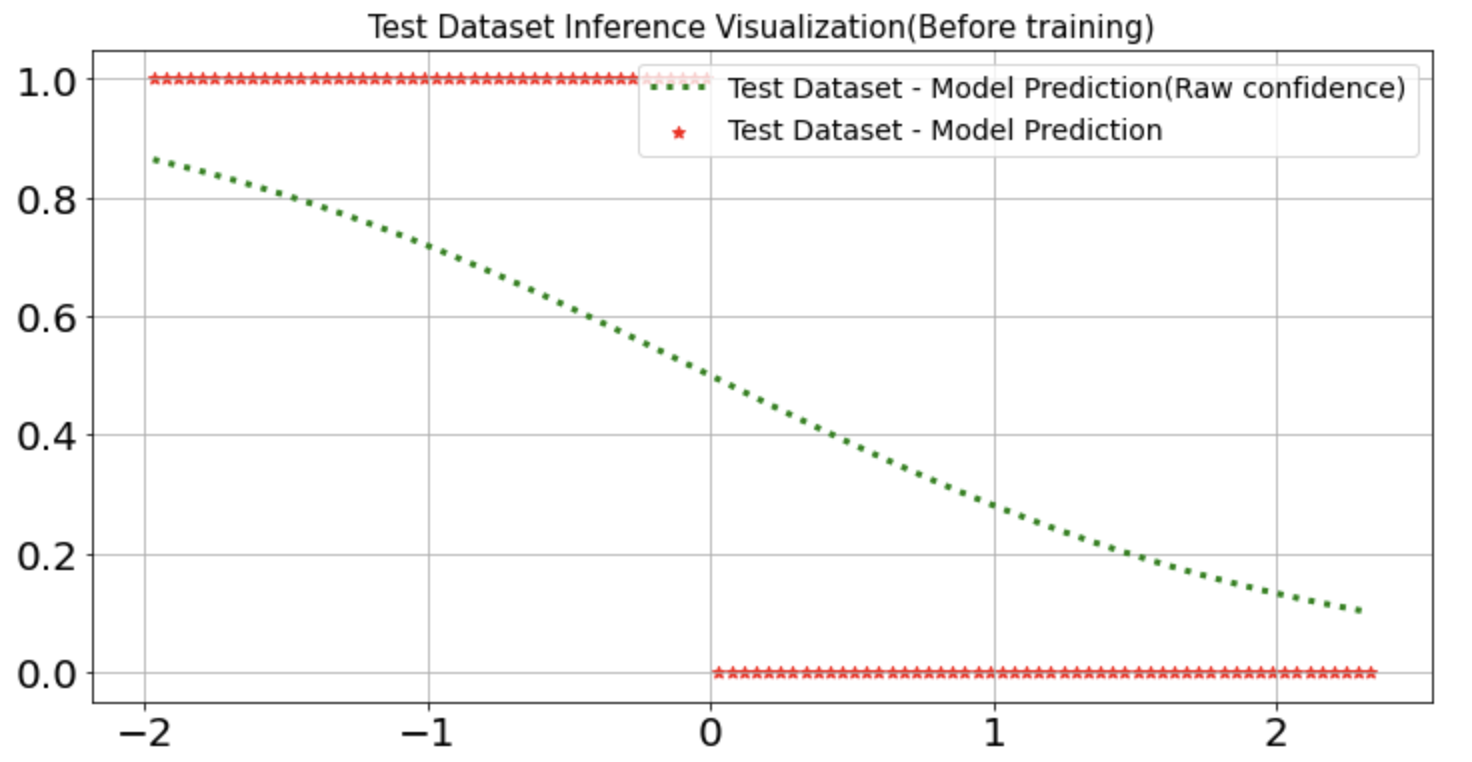
Test Dataset Inference Visualization(Before Training)
# Inference(predict x_test)
test_preds = model(test_x)

# Visualize
fig, ax = plt.subplots(figsize=(12, 6))
ax.scatter(test_x, (test_preds.numpy() >= 0.5).astype(np.float32), c='r', marker='*', label='Test Dataset - Model Prediction')
ax.plot(test_x, test_preds.numpy(), 'g:', linewidth=3, label='Test Dataset - Model Prediction(Raw confidence)')
ax.set_title('Test Dataset Inference Visualization(Before training)', fontdict={'fontsize': 15})
ax.legend(fontsize=14)
ax.tick_params(labelsize=20)
ax.grid()
Hyper Parameters, Loss Function, Optimizer
# Hyper Parameters
EPOCHS = 10
LR = 1e-2

# Loss Function
loss_obj = tf.keras.losses.BinaryCrossentropy()

# Optimizer
optimizer = tf.keras.optimizers.SGD(learning_rate=LR)
Training
from termcolor import colored


# tf.data
train_ds = tf.data.Dataset.from_tensor_slices((train_x, train_y))
train_ds = train_ds.shuffle(n_train).batch(8)

# Metrics
loss_metric = tf.keras.metrics.Mean()
acc_metric = tf.keras.metrics.BinaryAccuracy()

for epoch in range(1, EPOCHS+1):
    for x, y in train_ds:
        # Forward Propagation
        with tf.GradientTape() as tape:
            preds = model(x)
            loss = loss_obj(y, preds)

        # Back Propagation
        grads = tape.gradient(loss, model.trainable_variables)

        # Update Parameters
        optimizer.apply_gradients(zip(grads, model.trainable_variables))

        loss_metric(loss)
        acc_metric(y, preds)

    print(colored('Epoch: ', 'cyan'), epoch)
    template = 'Train Loss: {:.4f}\t Train Accuracy: {:.2f}%'

    epoch_loss = loss_metric.result()
    epoch_acc = acc_metric.result()
    print(template.format(epoch_loss, epoch_acc*100))

    loss_metric.reset_states()
    acc_metric.reset_states()
Epoch:  1
Train Loss: 1.0673	 Train Accuracy: 8.33%
Epoch:  2
Train Loss: 0.9715	 Train Accuracy: 8.33%
Epoch:  3
Train Loss: 0.8852	 Train Accuracy: 8.00%
Epoch:  4
Train Loss: 0.8124	 Train Accuracy: 8.33%
Epoch:  5
Train Loss: 0.7502	 Train Accuracy: 8.33%
Epoch:  6
Train Loss: 0.6974	 Train Accuracy: 40.33%
Epoch:  7
Train Loss: 0.6524	 Train Accuracy: 91.67%
Epoch:  8
Train Loss: 0.6135	 Train Accuracy: 91.67%
Epoch:  9
Train Loss: 0.5803	 Train Accuracy: 91.67%
Epoch:  10
Train Loss: 0.5508	 Train Accuracy: 91.67%
Test Dataset Inference Visualization(After Training)
# Inference(predict x_test)
test_preds = model(test_x)

# Visualize
fig, ax = plt.subplots(figsize=(12, 6))
ax.scatter(test_x, (test_preds.numpy() >= 0.5).astype(np.float32), c='r', marker='*', label='Test Dataset - Model Prediction')
ax.plot(test_x, test_preds.numpy(), 'g:', linewidth=3, label='Test Dataset - Model Prediction(Raw confidence)')
ax.set_title('Test Dataset Inference Visualization(After training)', fontdict={'fontsize': 15})
ax.legend(fontsize=14)
ax.tick_params(labelsize=20)
ax.grid()

Train Dataset을 학습하여
Train Dataset의 패턴과 유사하게 추론하고 있음을 확인할 수 있다.
Leave a comment